How Can We Help?
Program CyberPi with a Third-party Python Editor
This page describes how to program CyberPi with a third-party Python editor on Windows. Mac users can use it as a reference.
If you have installed a Python environment and third-party editor, go to step 3.
To program CyberPi on the third-party editor, you need to intsall the pyserial and cyberpi libraries in the Python environment configured for the editor. Use the following statements to install the libraries:
pip install pyserial
pip install cyberpi
1. Set up a Python environment
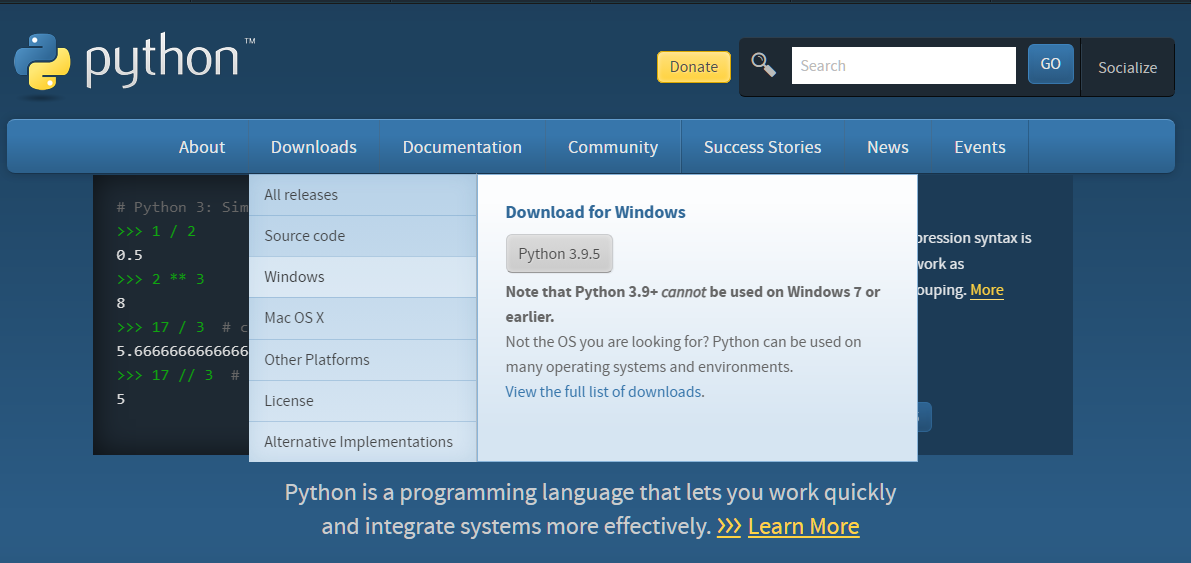
(1) Go to the Python.org to select and download a Python version that is applicable to your operating system. The versions 3.6 to 3.8 are recommended. The latest version may fail to work properly. For example, versions later than 3.9 doesn’t support Windows 7.
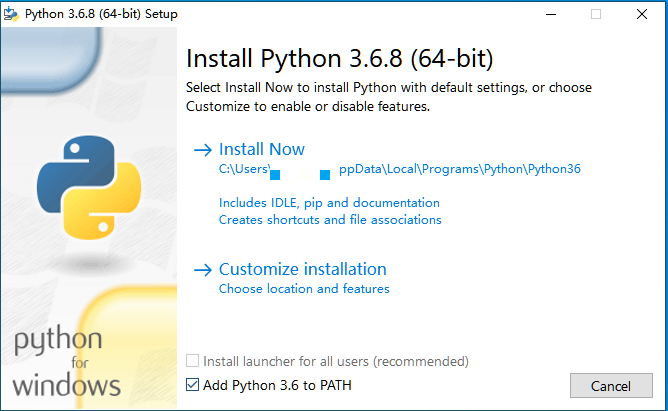
(2) Double-click the software you’ve downloaded, check Add Python 3.6 to PATH, and click Install Now.
You can also click Customize installation to install Python environment to a specified directory.
2. Install and configure the third-party Python editor (use Visual Studio Code as an example)
Note: The steps may vary depending on the editor you are using. It is also recommended that you configure the installed Python environment on the editor.
(1) Download a VS Code version applicable to your operating system. Download VS Code
(2) Double-click the downloaded installation package to install it. You can install it as prompted.
(3) Click the VS Code icon on the desktop to open it.
(4) On the left side of the software page, click the icon marked in the following figure.

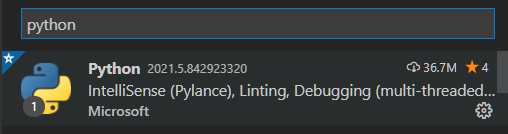
(5) Search for Python and install it. Note that the publisher is Microsoft.
(6) Configure the previously installed Python environment on the VS Code editor.
(7) Create a new folder and a .py file and you can write basic Python programs.
3. Prepare the third party editor for programming CyberPi
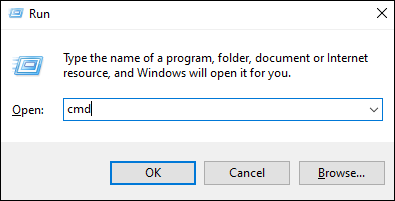
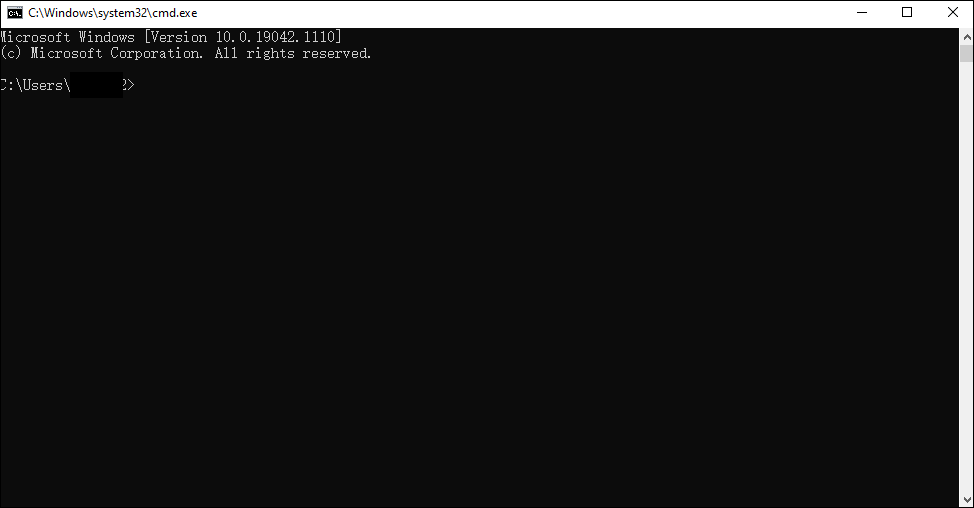
(1) In Windows OS, press Windows + R on the keyboard, type CMD and press Enter.
The CMD window is displayed.
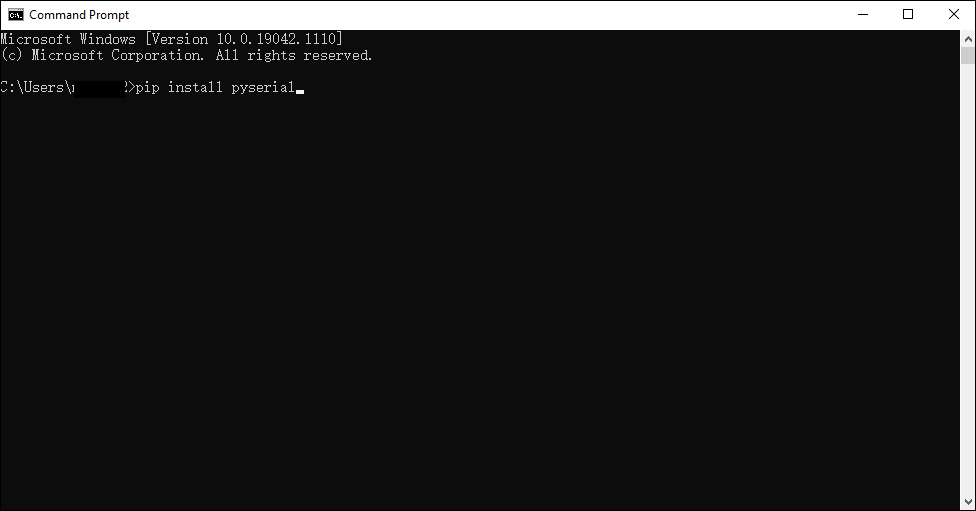
(2) Install the pyserial library, which enables CyberPi to connect to the third-party editor through a USB cable or Bluetooth dongle.
Type pip install pyserial in the CMD window and press Enter, and wait till the librarry is installed.
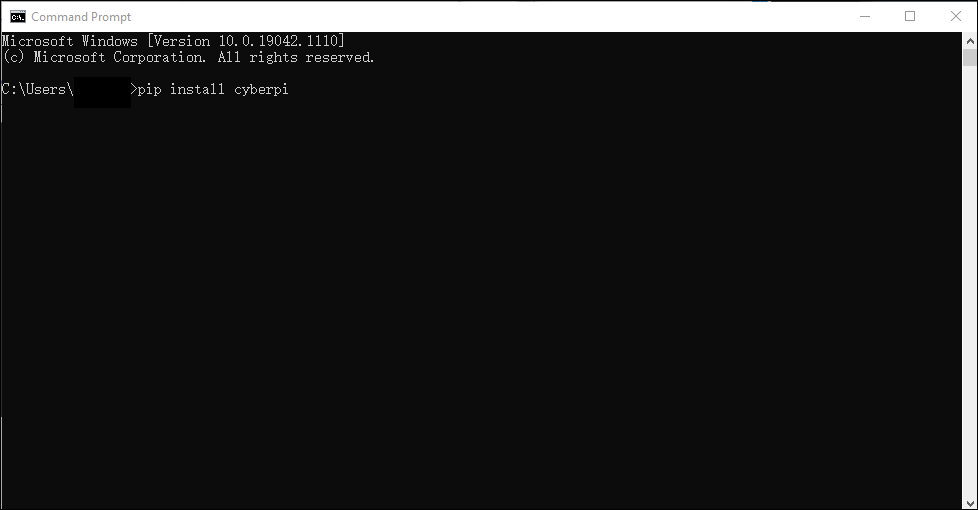
(3) Install the cyberpi library, a Python library for programming CyberPi in online mode.
Type pip install cyberpi in the CMD window and press Enter, and wait till the librarry is installed.
For description of the Python APIs, see Python API Documentation for CyberPi.
After the installation is completed, you can write programs on the editor for which a Python environment has been configured.
Note
Currently on a third-party editor, you can program CyberPi only in online mode.
Example programs
CyberPi mouse
Need to install pynput module. Refer to the above step pip install pynput
""""

Name: Cyber Pi mouse

Introduction:

Use the gyroscope module, buttons of Cyber Pi, and the mouse control function of pynput module, to convert Cyber Pi into a mouse.

You can also use the Bluetooth module to convert Cyber Pi into a wireless mouse.

""""

from pynput.mouse import Button, Controller

import cyberpi

import time

mouse = Controller()

while True:

if cyberpi.is_tiltback():

mouse.move(-3, 0)

print(mouse.position)

if cyberpi.is_tiltforward():

mouse.move(3, 0)

if cyberpi.is_tiltleft():

mouse.move(0, -3)

if cyberpi.is_tiltright():

mouse.move(0, 3)

if cyberpi.controller.is_press("b"):

mouse.press(Button.left)

mouse.release(Button.left)

mouse.press(Button.left)

mouse.release(Button.left)

if cyberpi.controller.is_press("a"):

mouse.press(Button.right)

mouse.release(Button.right)

time.sleep(0.01)
CyberPi voice typer
""""

Name: 074 Cyber Pi voice typer

Hardware: Cyber Pi

Introduction:

Use the voice recognition function of Cyber Pi, and the keyboard control function of pynput module.

The result of voice recognition will be printed out in a file through pynput.

This program currently only supports English.

""""

import cyberpi

from pynput.keyboard import Key, Controller

import time

keyboard = Controller()

cyberpi.console.clear()

cyberpi.led.on(0, 0, 0)

cyberpi.set_recognition_url()

cyberpi.cloud.setkey("Enter the cloud service authorization code") # You can get it through your mBlock account

cyberpi.wifi.connect("WIFI name", "WIFI password")

while not cyberpi.wifi.is_connect():

pass

cyberpi.led.on(0,0,255)

cyberpi.console.println("WIFI connected")

cyberpi.console.println("--------------")

cyberpi.console.println("Press the button A to start voice recognition")

while True:

if cyberpi.controller.is_press('a'):

keyboard.press(Key.space)

cyberpi.console.clear()

cyberpi.led.on(100, 0, 0)

cyberpi.console.println("Start voice recognition")

cyberpi.audio.play("switch")

cyberpi.console.println("--------------")

cyberpi.cloud.listen("english", 2)

cyberpi.led.on(0, 0, 0)

say = cyberpi.cloud.listen_result()

cyberpi.console.println(say)

cyberpi.console.println("--------------")

for i in say:

if i == '':

keyboard.press(' ')

else:

keyboard.press(str(i))

time.sleep(0.03)
Matplotlib volume bar
import cyberpi

import time

from matplotlib import pyplot as plt

plt.rcParams['font.sans-serif'] = ['Microsoft YaHei']

plt.ion()

while True:

loud = cyberpi.get_loudness()

plt.clf()

plt.xlabel("Data name")

plt.ylabel("Volume readings")

y_locator = plt.MultipleLocator(5)

ax=plt.gca()

ax.yaxis.set_major_locator(y_locator)

plt.ylim(0,100)

plt.bar('Volume', loud, align='center',label=f'Temperature{loud}')

plt.title('Cyber Pi sound sensor readings')

plt.legend()

plt.show()

plt.pause(0.01)
Matplotlib multi-chart display
from matplotlib import pyplot as plt

import time

import cyberpi

loud_list = []

bri_list = []

plt.rcParams['font.sans-serif'] = ['Microsoft YaHei']

plt.ion()

plt.figure(figsize=(10,10))

plt.figure(1)

x_locator = plt.MultipleLocator(5)

y_locator = plt.MultipleLocator(5)

while True:

loud = cyberpi.get_loudness()

bri = cyberpi.get_bri()

loud_list.append(loud)

bri_list.append(bri)

battery = cyberpi.get_battery()

size = [battery, 100-battery]

status = [f'Remaining power:{battery}%', f'Power used:{100-battery}%']

ax1 = plt.subplot(221)

plt.title('Light line chart')

ax1.plot(bri_list)

ax2 = plt.subplot(222)

plt.title('Sound histogram')

ax2.xaxis.set_major_locator(x_locator)

ax2.yaxis.set_major_locator(y_locator)

plt.ylim(0,100)

ax2.bar('sound', loud)

ax3 = plt.subplot(223)

ax3.xaxis.set_major_locator(x_locator)

ax3.yaxis.set_major_locator(y_locator)

plt.xlim(0,100)

plt.ylim(0,100)

plt.title('Sound and volume scatter chart')

ax3.scatter(loud_list,bri_list)

ax4 = plt.subplot(224)

ax4.pie(size, labels = status, radius=1,wedgeprops = {'width': 0.3, 'edgecolor': 'w'})

plt.title('Cyber Pi power')

plt.pause(0.2)

plt.clf()

if cyberpi.controller.is_press('a'):

break

if len(bri_list) > 500:

bri_list = []

loud_list = []