How Can We Help?
pyecharts— Liquid Chart
pyecharts— Liquid Chart
The pyecharts library is used to visualize data.
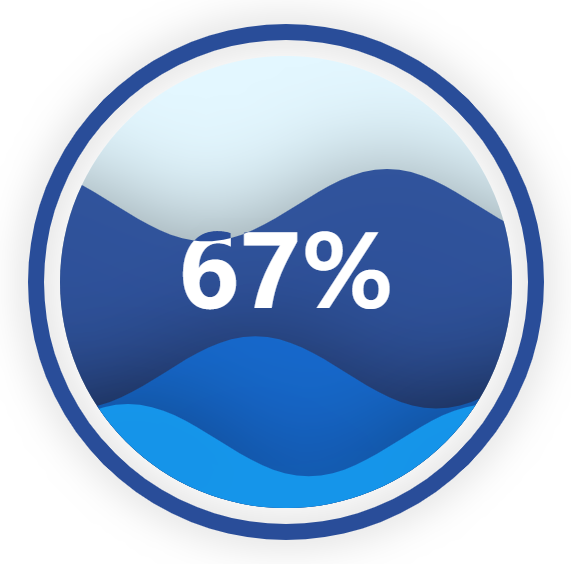
The following shows a liquid chart.
from pyecharts import options as opts
from pyecharts.charts import Liquid, Page
from pyecharts.globals import SymbolType
import os
def liquid() -> Liquid:
c = (
Liquid()
.add(“lq”, [0.67, 0.30, 0.15])
.set_global_opts(title_opts=opts.TitleOpts(title=”Liquid”))
)
return c
liquid().render(‘liquid.html’)
os.system(“open liquid.html”)
The pyecharts library provides many other functions. You can download the following example programs to view data into various charts.