How Can We Help?
Data Chart
Data Chart
The Data Chart extension can be used to visualize your data. When you use it, you can import data sets, input data in batches, or collect and generate data in real time through blocks, and it can display data in tables, line charts, bar charts, dual-axis charts, or pie charts.
Note:
- A maximum of 500 pieces of data can be displayed in total.
- A maximum of 15 data groups can be displayed, and a maximum of 300 pieces of data can be included in one data group.
Let’s have a try.
Add the Data Chart extension
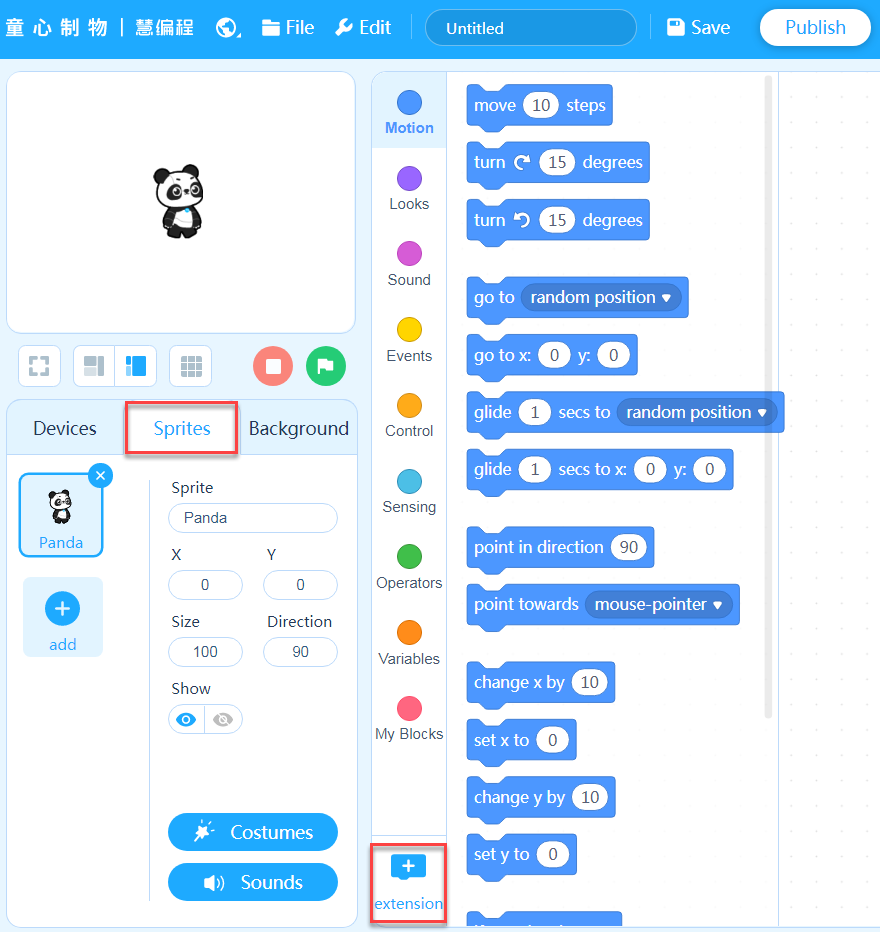
1. Click the Sprites tab and click + extension at the bottom of the blocks area.
2. On the Extension center page that appears, click + Add at the bottom of Data Chart.

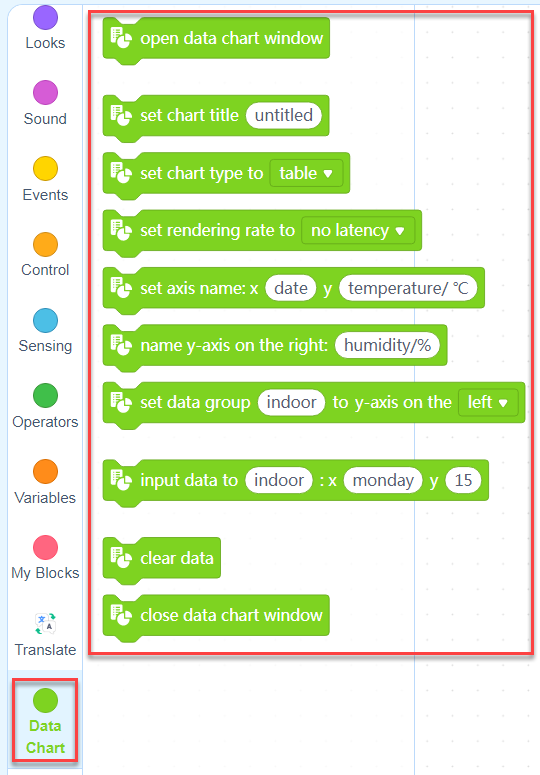
After being added, the extension and its block are displayed in the blocks area.
Use the Data Chart blocks
Let’s make a line chart to show the temperature of Shenzhen in a week.
Set the table
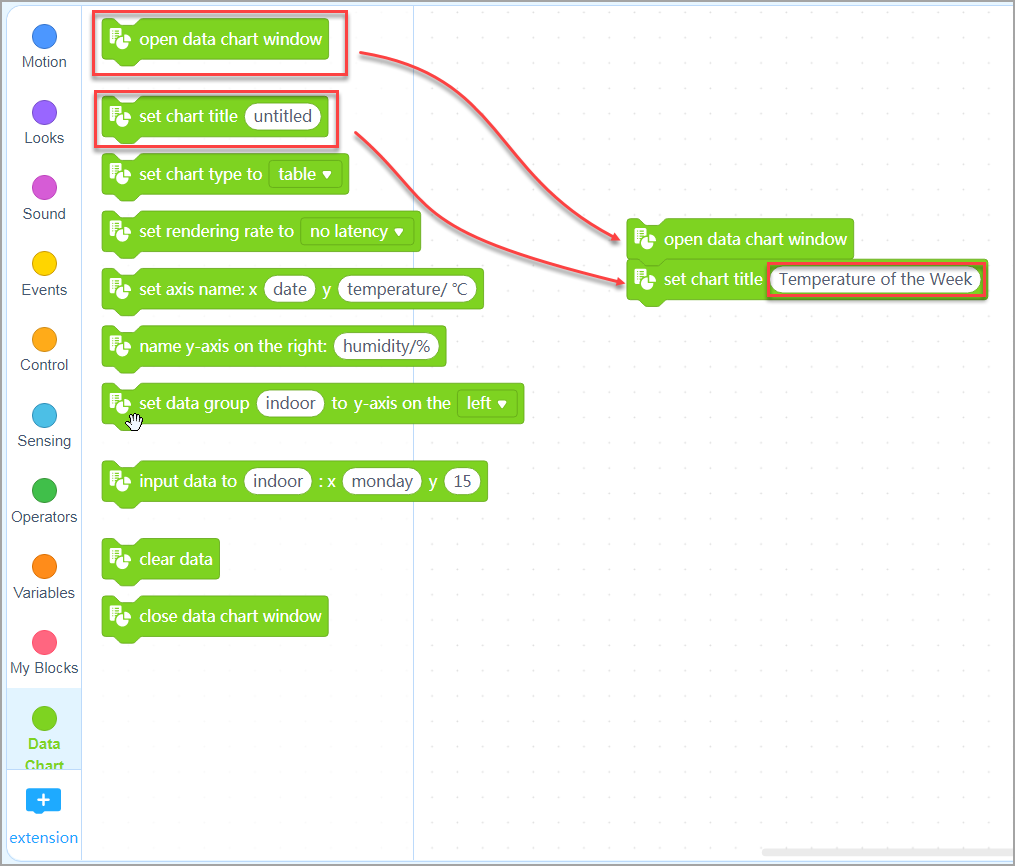
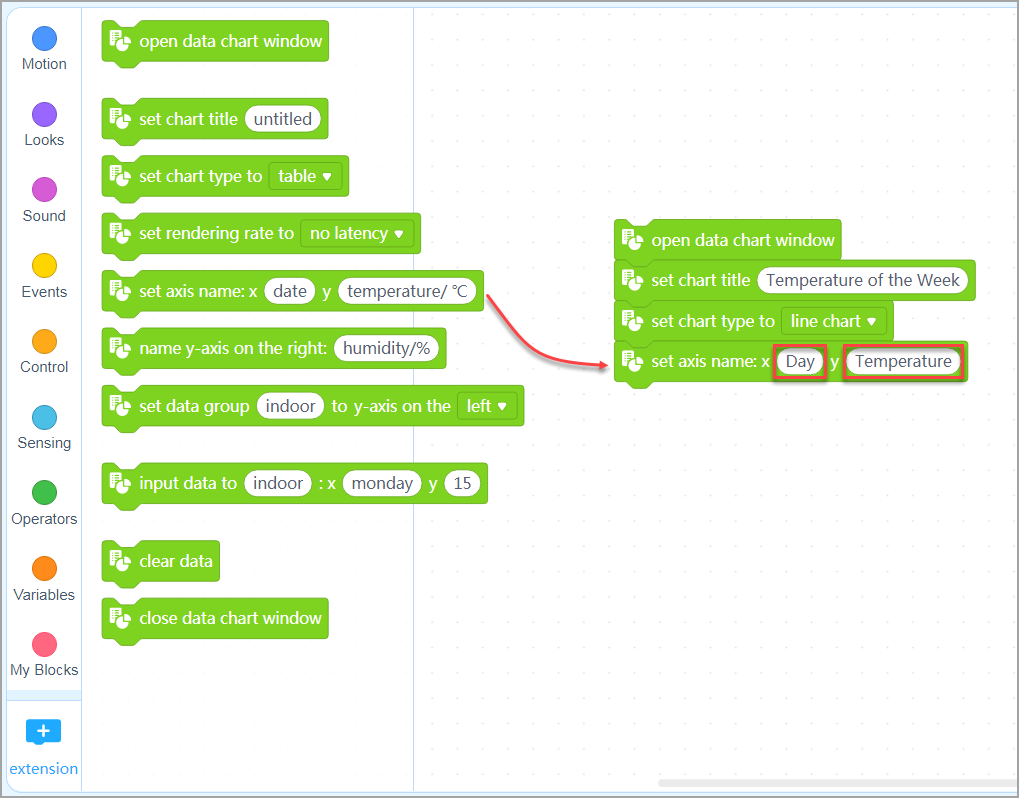
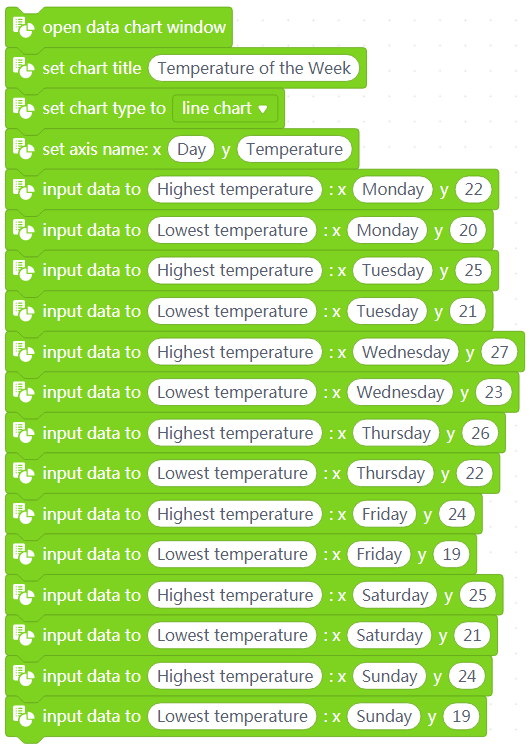
(1) Drag the Data Chart blocks open data chart window and set chart title ( ) to the scripts area, and name the chart Temperature of the Week.
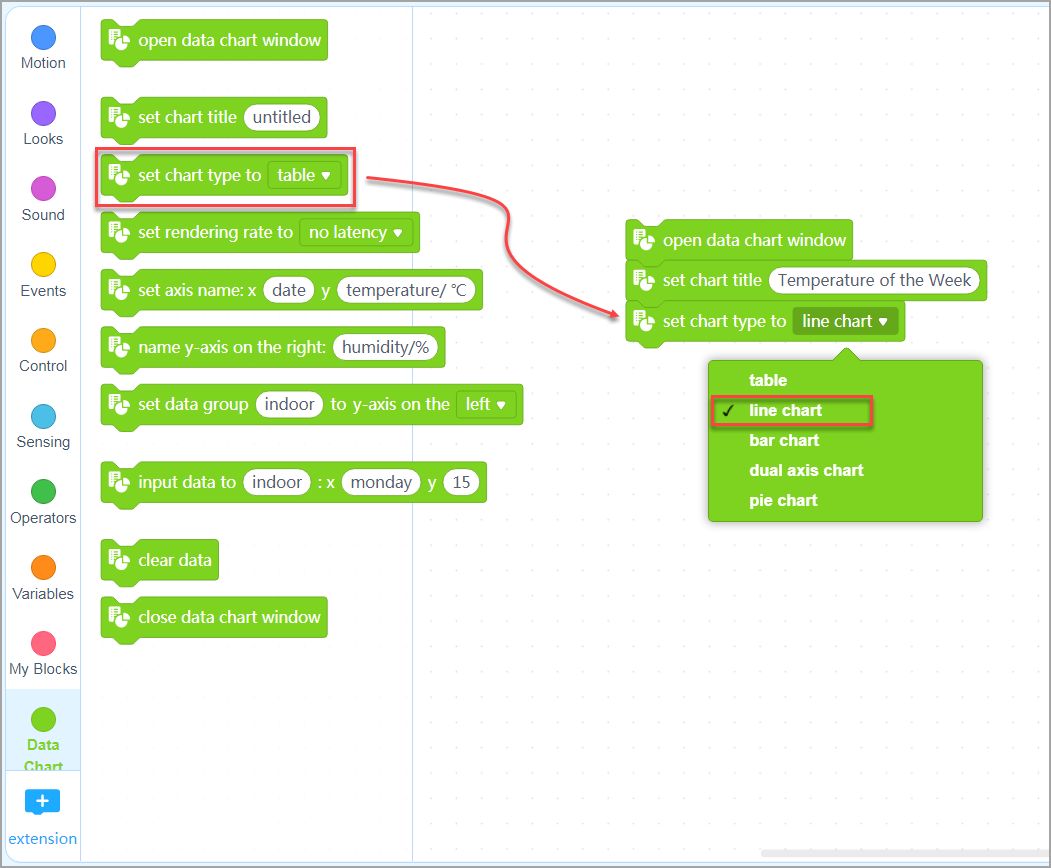
(2) Drag the Data Chart block set chart type to ( ) to the scripts area and choose line chart from the drop-down list box.
(3) Drag the Data Chart block set axis name: x () y ( ) to the scripts area and set the x axis name to Day and y axis name to Temperature.
Input data
(4) Enter the data. Let’s enter the following data to generate a line chart.
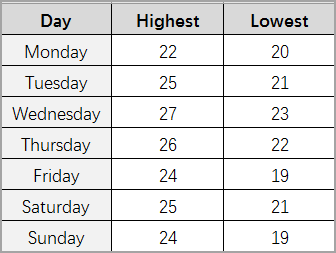
Note:
The data described in the preceding table is used just for demonstration.
(5) Drag the Data Chart block input data to ( ): x ( ) y ( ) to the scripts area. The temperature data of each day includes the highest and lowest temperature. Enter the data for Monday as follows.
(6) Right-click the block and choose Duplicate to quickly add 12 input data to ( ): x ( ) y ( ) blocks. Enter the temperature data of Tuesday to Sunday.
Add an event
(7) Drag the Events block when green flag clicked to the scripts area and drop it on the top of the other blocks.
You can choose to display the data in bar or pie charts. You can also choose to view the data in a table.
Dual-axis chart
The dual-axis chart is a special chart type can be used to display multiple data groups. The data of these data groups may be recorded in different units but can share the same x axis.
Example:
Based on the highest and lowest temperature of the week, we can analyze the relation between the temperature and humidity.
The unit of humidity data is percentage (%), and that of temperature is degree centigrade (℃). Therefore, these data can’t be displayed in a one-axis coordinate system.
You can use a dual-axis chart to display these data.
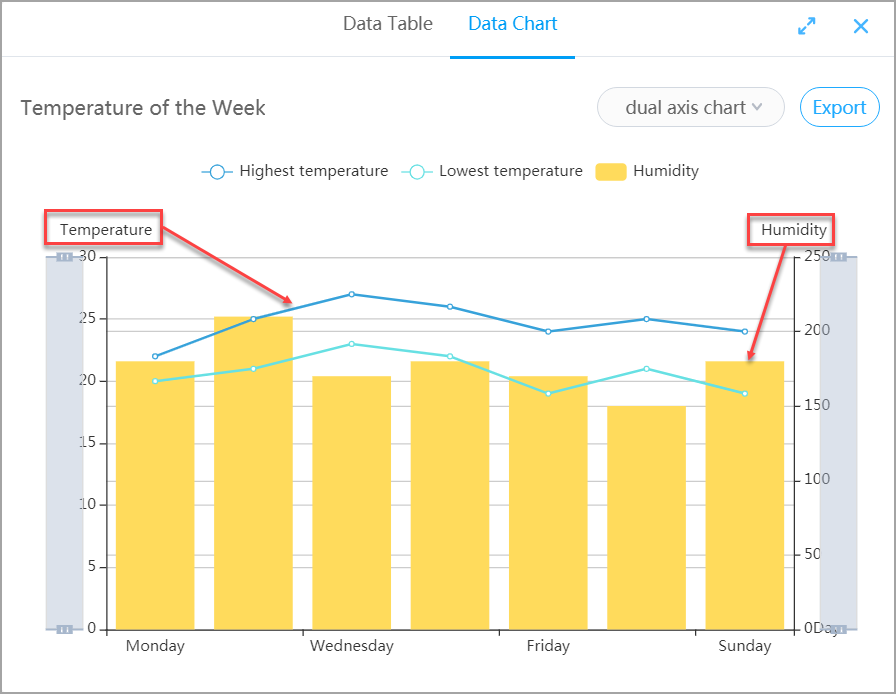
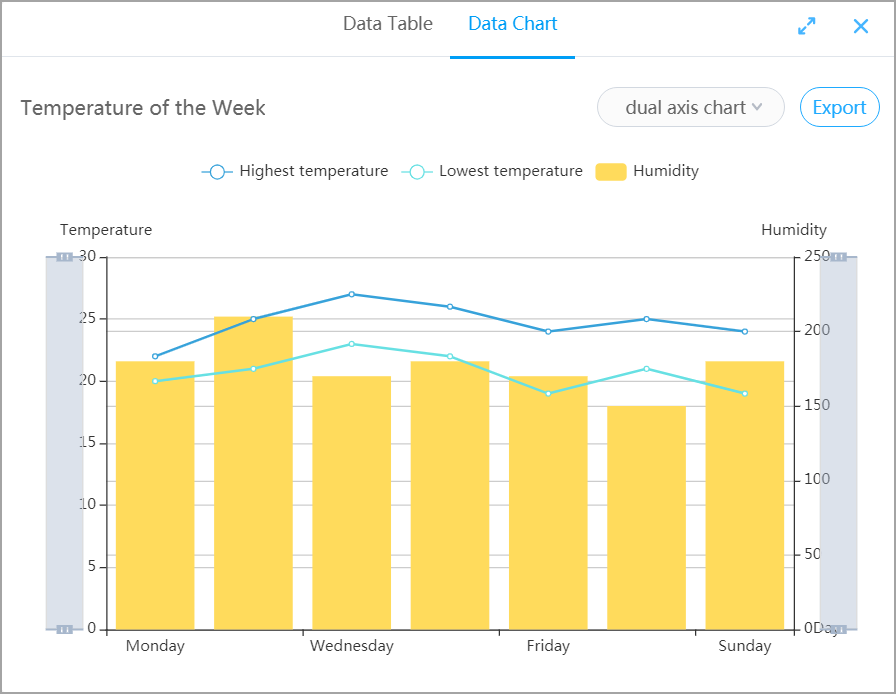
As shown in the preceding figure, the humidity data is displayed in a bar chart, corresponding to the y axis on the right. The temperature data is displayed in a line chart, corresponding to the y axis on the left. The humidity and temperature data share the same x axis.
You can configure a dual-axis chart in mBlock 5 as follows (based on the preceding temperature example):
(1) Set the title of the y axis on the right.
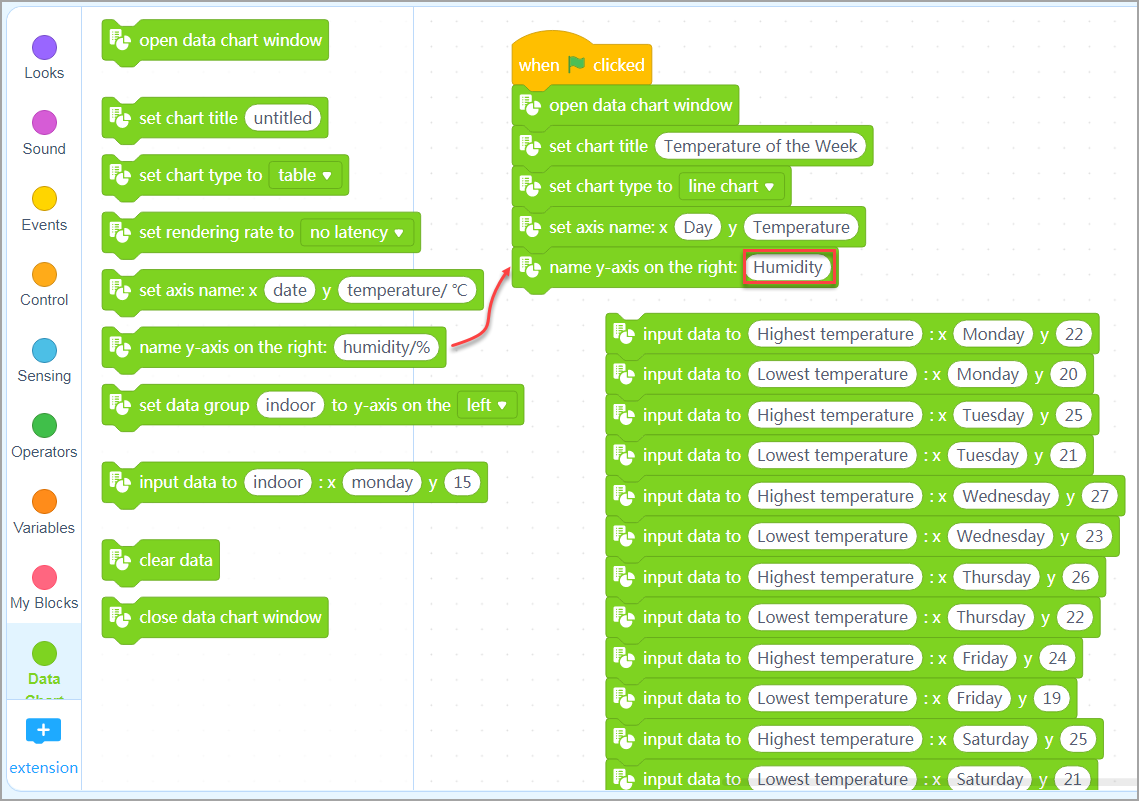
(2) Specify which data groups are to be displayed on the y axis on the left, and which on the y axis on the right.
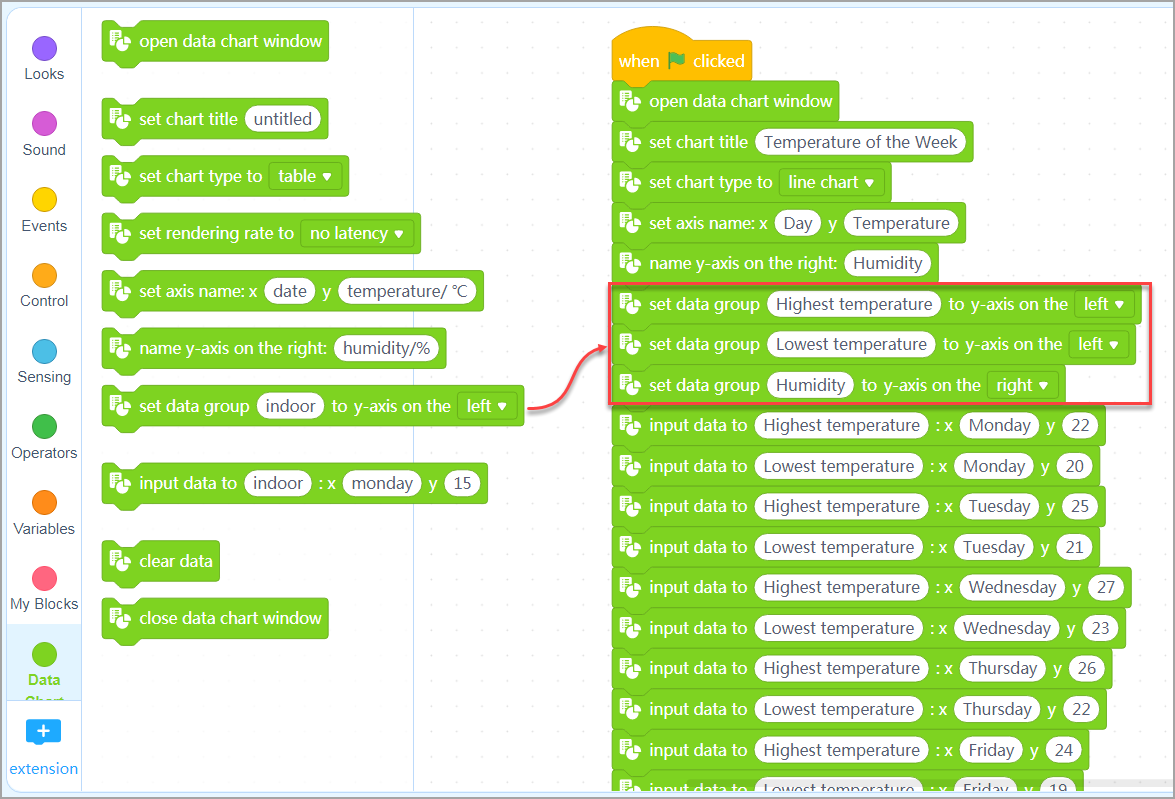
Note:
The name y-axis on the right: ( ) and set data group ( ) to y-axis on the ( ) blocks can be used only for dual-axis charts.
When configuring a dual-axis chart, you don’t need to set all data in the chart. For example, if you have four data groups, A, B, C, and D, you can set B to the y axis on the left, and D on the y axis on the right. In this way, data groups A and C are not displayed.
The following dual-axis chart displays the temperature and humidity of the week.
Scale data
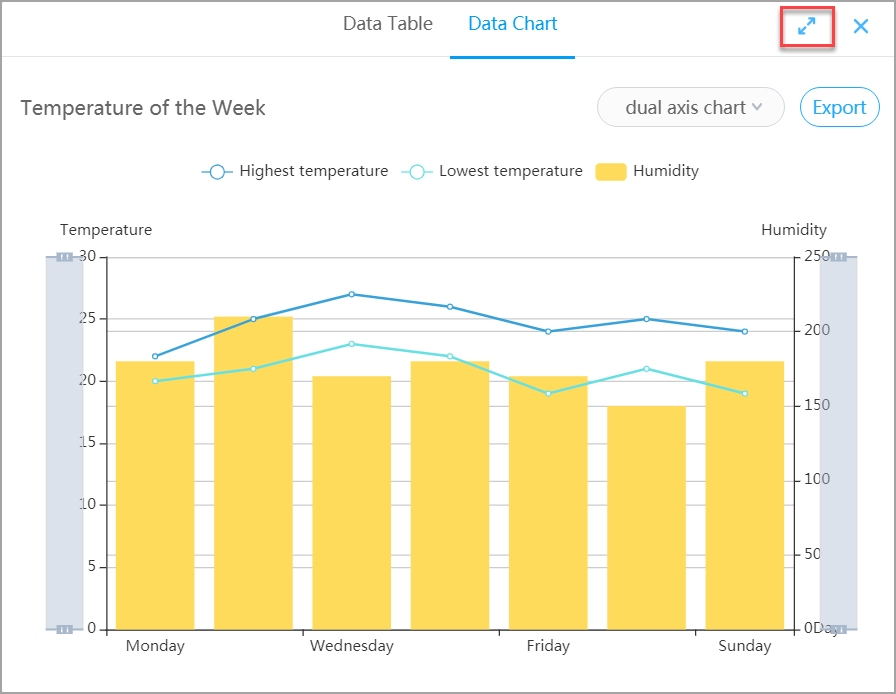
It may be difficult to compare and analyze some data when the difference between the data is not obvious. When this happens, you can scale the chart to make the difference more obvious in one of the following ways:
Way 1: Click the zoom-in/zoom-out button in the upper right corner to zoom in the window.
Way 2: Use the mouse wheel on your PC, gestures on your touch panel, or your finger in the app to drag the chart to scale or move some data. In a dual-axis chart, you can also control the scaling by dragging a bar on the side.
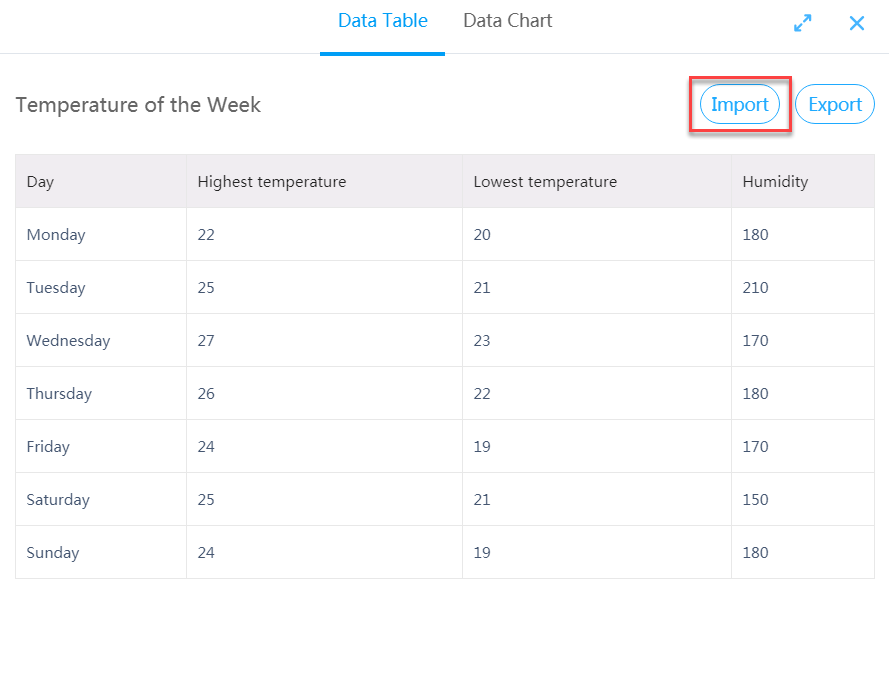
Import data sets
In addition to using blocks to collect and generate data in real time, you can also import data sets in batches.
On the Data Table tab, click Import, select a .csv file from your local disk, and click Open.
Note:
- The size of the .csv file to be imported can’t be greater than 1 M.
- You can’t import a file when you use the Data Chart extension on a mobile device.
- The total number of pieces of data in the .csv file can’t be greater than 500, the number of data groups can’t be greater than 15, and the number of pieces of data in one data group can’t be greater than 300.
Delete data
After you close the data chart window, the data you have input in the chart is not automatically deleted. To delete the data, you need to use the clear data( ) block. As shown in the following figure, you can delete the data before you input some other data.