How Can We Help?
Display
30. print[string_2] and move to a newline

Displays texts on CyberPi’s screen with forced line breaks
How to use
Click to input the text to be displayed.
When this block is executed, a forced line break is inserted after the current text is displayed, and the next text is displayed on a new line.
Example
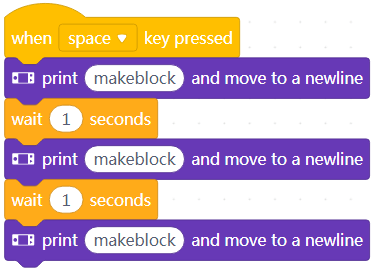
In Live mode, when you press the space key, the texts are displayed on CyberPi’s screen with forced line breaks, as shown in the following figure.
31. print[string_2]

Displays texts on CyberPi’s screen with automatic line breaks
How to use
Click to input the text to be displayed.
When this block is executed, texts are displayed on the same line, and when a line is full, the texts are continued on new lines.
Example
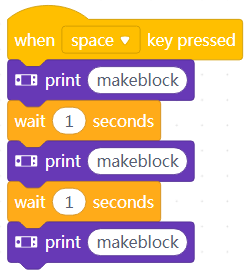
In Live mode, when you press the space key, the texts are displayed on CyberPi’s screen with automatic line breaks, as shown in the following figure.
32. set print size to [inputMenu_1]

Displays the specified text at the specified size on the screen of CyberPi
How to use
Click to select a font size from the drop-down list box.
Example
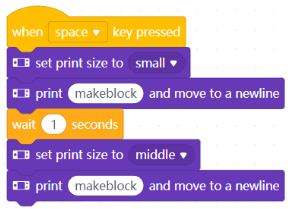
After you press the space key, CyberPi displays “makeblock”, and one second later, CyberPi displays “makeblock” in two lines and the size of all the texts are enlarged.
Note: CyberPi can’t display texts at two different sizes at a time.
33. show label [fieldMenu_1] [string_2] at [fieldMenu_2] by[inputMenu_4]pixel

Displays the specified text at the specified size in the specified position
How to use
You can display multiple texts on the screen by setting labels for them. A maximum of eight texts can be displayed.
Click to select a label, position, and font size from the drop-down list boxes, and enter a text.
Examples
Example 1
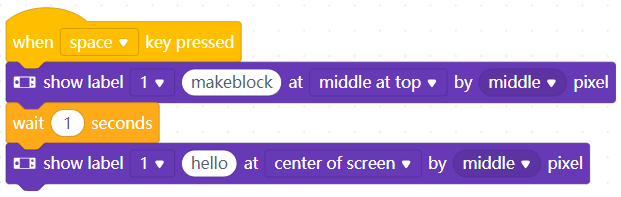
After you press the space key, makeblock is displayed on the screen and disappears in one second, and then hello is displayed.
Example 2
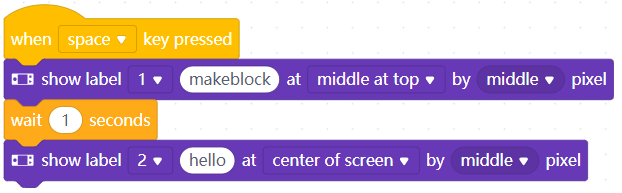
After you press the space key, makeblock is displayed on the screen, and one second later, hello is also displayed.
34. show label [fieldMenu_1] [string_2]at x[number_2] y[number_3]by[inputMenu_4]pixel

Displays the specified text at the specified size in the specified position (x,y)
How to use
You can display multiple texts on the screen by setting labels for them. A maximum of eight texts can be displayed.
Click to select a label and font size from the drop-down list boxes, and enter a text and the coordinates.
Note: The anchor point of the text is the top-left point, and therefore the coordinates you set is those of the top-left point of the text.
Examples
Example 1
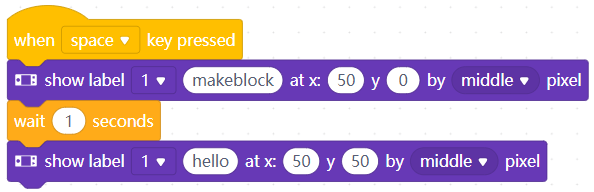
After you press the space key, makeblock is displayed on the screen and disappears in one second, and then hello is displayed.
Example 2
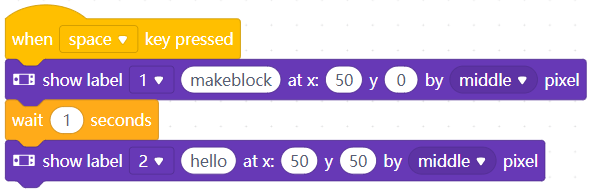
After you press the space key, makeblock is displayed on the screen, and one second later, hello is also displayed.
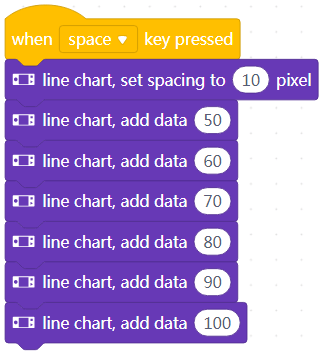
35. line chart, add data[number_1]

Adds a piece of data and displays a line chart on CyberPi’s screen
How to use
Data setting range: 0–100
If a value to be input exceeds the setting range, rescale all the original data to be within the setting range.
For example, you can rescale the values 200, 300, and 400 to 20, 30, and 40, respectively.
This block is used to add one piece of data at a time. You can use this block multiple times to add multiple pieces of data.
Example
In Live mode, when you press the space key, a line chart is displayed on CyberPi’s screen.
36. line chart, set spacing to [number_3] pixel

Sets the spacing between data points in a line chart
How to use
Spacing setting range: 0–128
For example, the following figures show the line charts with the same data but different data point spacings.
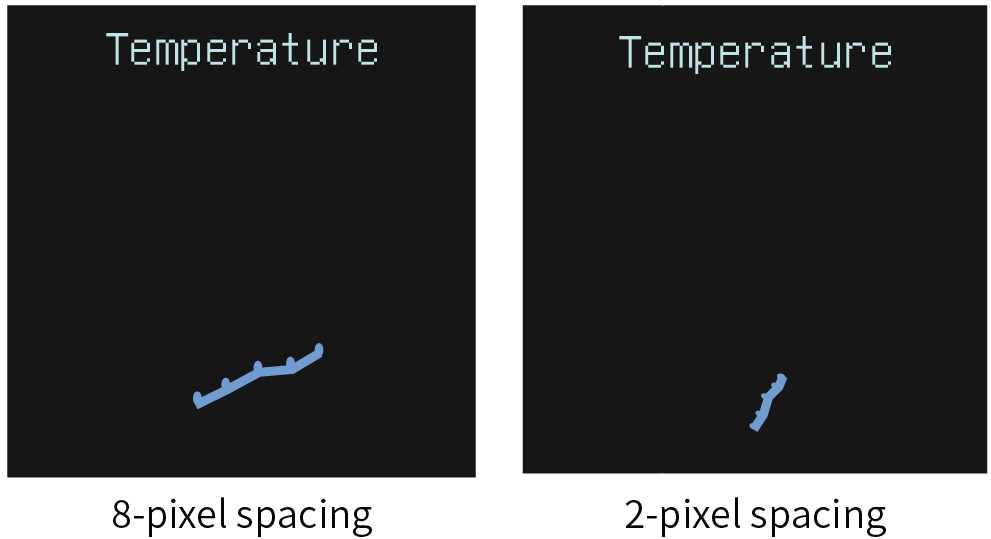
Example
In Live mode, when you press the space key, a line chart is displayed on CyberPi’s screen.
You can change the shape of the line chart by changing the spacing.
37. bar chart, add data[number_1]

Adds a piece of data and displays a bar chart on CyberPi’s screen
How to use
Data setting range: 0–100
If a value to be input exceeds the setting range, rescale all the original data to be within the setting range.
For example, you can rescale the values 200, 300, and 400 to 20, 30, and 40, respectively.
This block is used to add one piece of data at a time. You can use this block multiple times to add multiple pieces of data.
Note: To add multiple pieces of data in a bar chart, you need to set multiple brush colors to draw multiple data bars.
Example
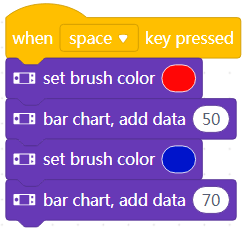
In Live mode, when you press the space key, a bar chart with two data bars is displayed on CyberPi’s screen.
38. table, input[string_3] at row[fieldMenu_1], column[fieldMenu_2]

Adds a piece of data and displays a table on CyberPi’s screen
How to use
A maximum table of 4 (rows) × 3 (columns) is supported.
Click to set the row, column, and the content to be input.
Define a cell by setting the row and column.
When the content to be displayed in a cell is too long, it keeps scrolling to the right in the cell.
You can input texts into the table.
Example
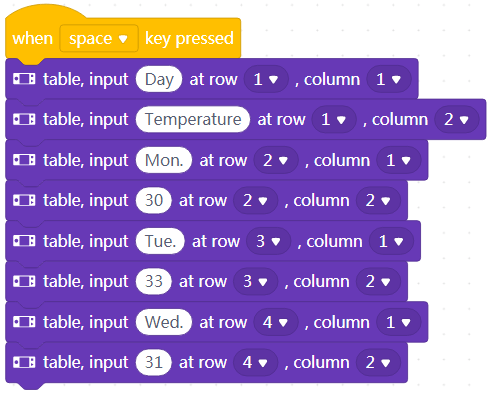
In Live mode, when you press the space key, a 4 × 2 table is displayed on CyberPi’s screen.
39. set brush color[color_1]

Sets the color of the brush
How to use
The brush here is used to draw line charts, bar charts, and tables. By setting the color of the brush, you can draw a line chart with different colors of lines, a bar chart with differnt colors of columns, and a table with the specified font color.
Click to set the color of the brush.
Example
Example 1
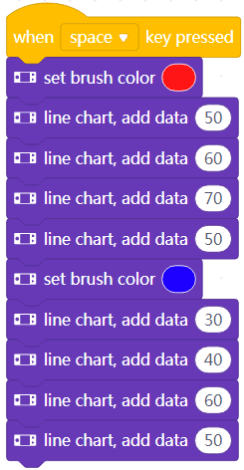
In Live mode, when you press the space key, a line chart with two different colors of lines is displayed on CyberPi’s screen.
Example 2
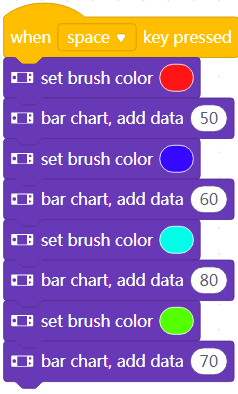
In Live mode, when you press the space key, a bar chart with four different colors of bars is displayed on CyberPi’s screen.
Example 3
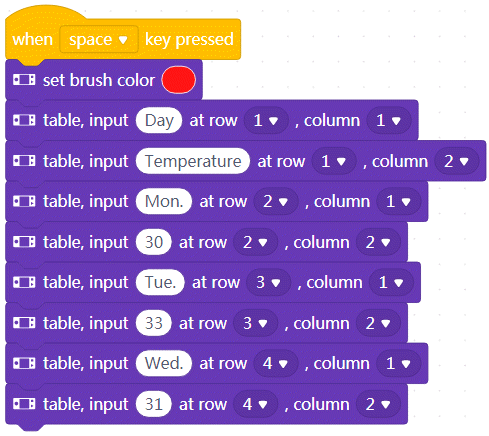
In Live mode, when you press the space key, a table with the font color of red is displayed on CyberPi’s screen.
40. set brush color to R [number_1] G [number_2] B [number_3]

Sets the brush to the color that is the combination of the specified intensity of red, green, and blue
How to use
The brush here is used to draw line charts, bar charts, and tables. By setting the color of the brush, you can draw a line chart with different colors of lines, a bar chart with differnt colors of columns, and a table with the specified font color.
Click to set the intensity of red, green, and blue.
Intensity setting range: 0–255
Example
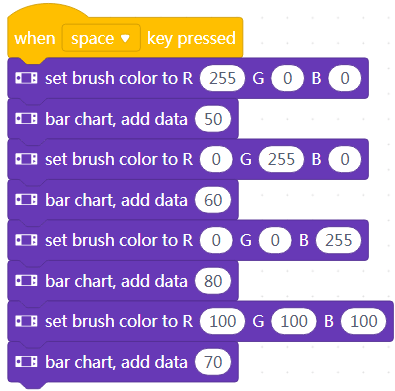
In Live mode, when you press the space key, a bar chart with four different colors of bars is displayed on CyberPi’s screen.
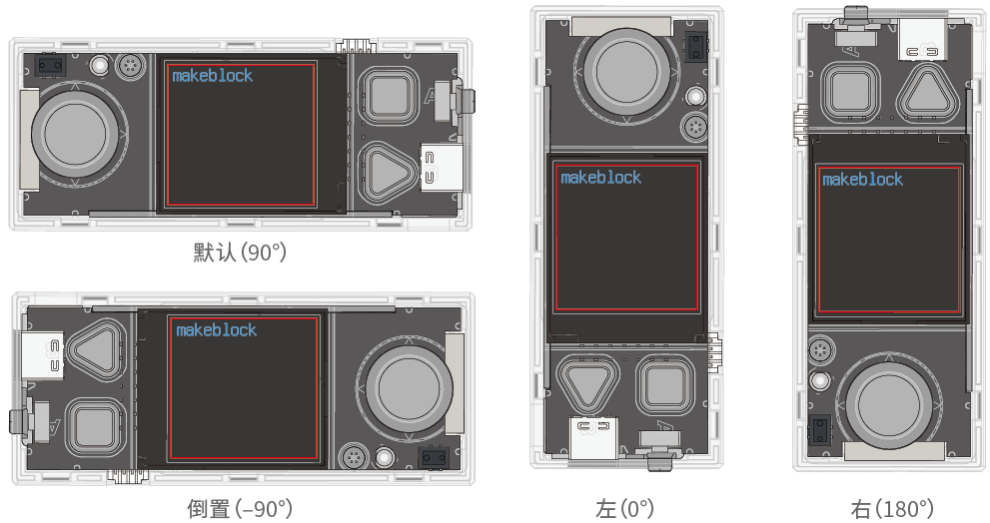
41. screen towards[fieldMenu_1]

Sets CyberPi’s screen to the specified displaying direction
How to use
With this block, you can rotate the displaying direction of CyberPi’s screen. Four direciton options are provided, as shown in the following:
Example
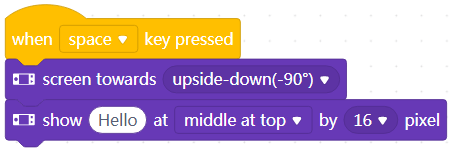
In Live mode, when you press the space key, CyberPi displays “Hello” on its screen, as shown in the following figure.
42. clear screen

Clears CyberPi’s screen
How to use
To display information on CyberPi’s screen, you need to use this block to clear the screen first. Otherwise, the information may be superimposed on the information displayed before.
Example
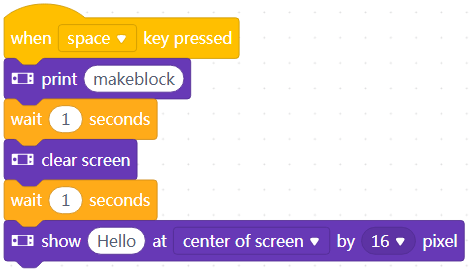
In Live mode, when you press the space key, CyberPi displays “makeblock” on its screen and then clears the screen before displaying “Hello.”